What is it?
traceroute and tracepath are command line tools that allow to track which paths packets take to the destination. When you send a packet, it takes a very specific route on its way to the destination. In home networks, you usually send the requests to your router, which acts as a gateway to the Internet. The router then forwards the packet to an Internet Service Provider (ISP), which forwards the packet to the next network so that it gets closer and closer to its destination. For various reasons, it can be helpful to know this path.
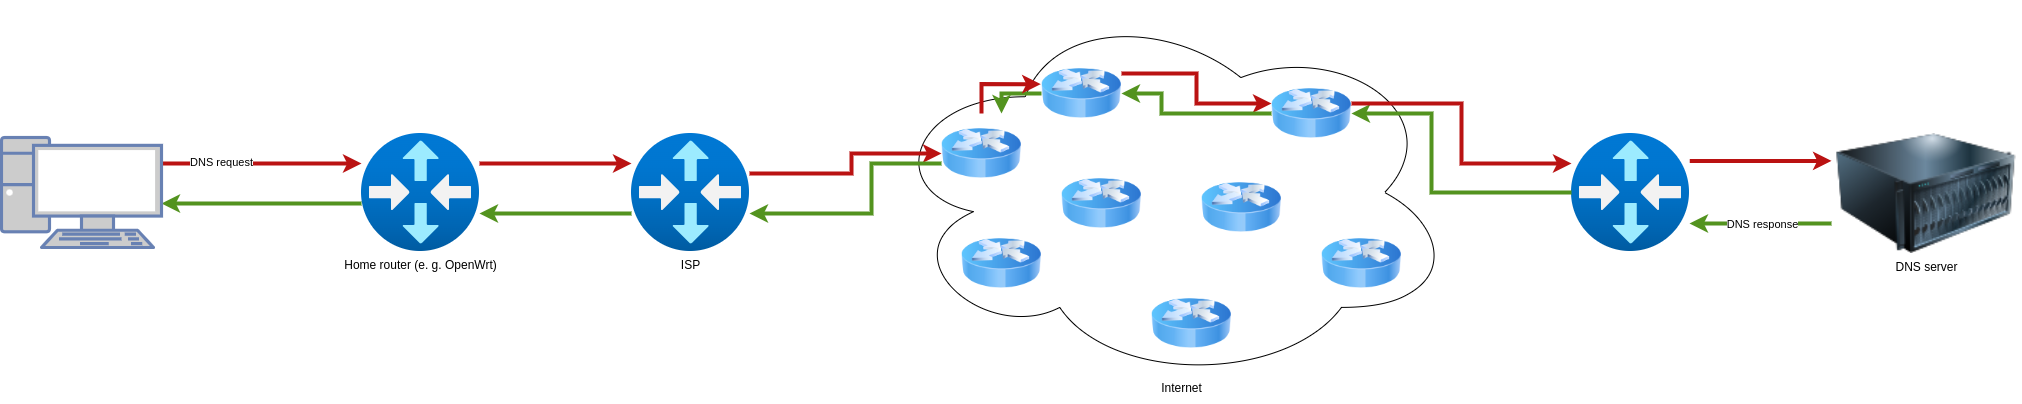
In this example, a DNS request is sent to a DNS server. This is generated in the user’s computer and next sent to the home router (for example, OpenWrt), which in turn forwards the request to the ISP. The ISP now looks up which route leads to the destination and sends the packet on accordingly. At some point it arrives at the router from the DNS server. The router forwards the request to the DNS server. The DNS server responds and the packet takes the same route back.
What can go wrong?
A number of things can go wrong along the way:
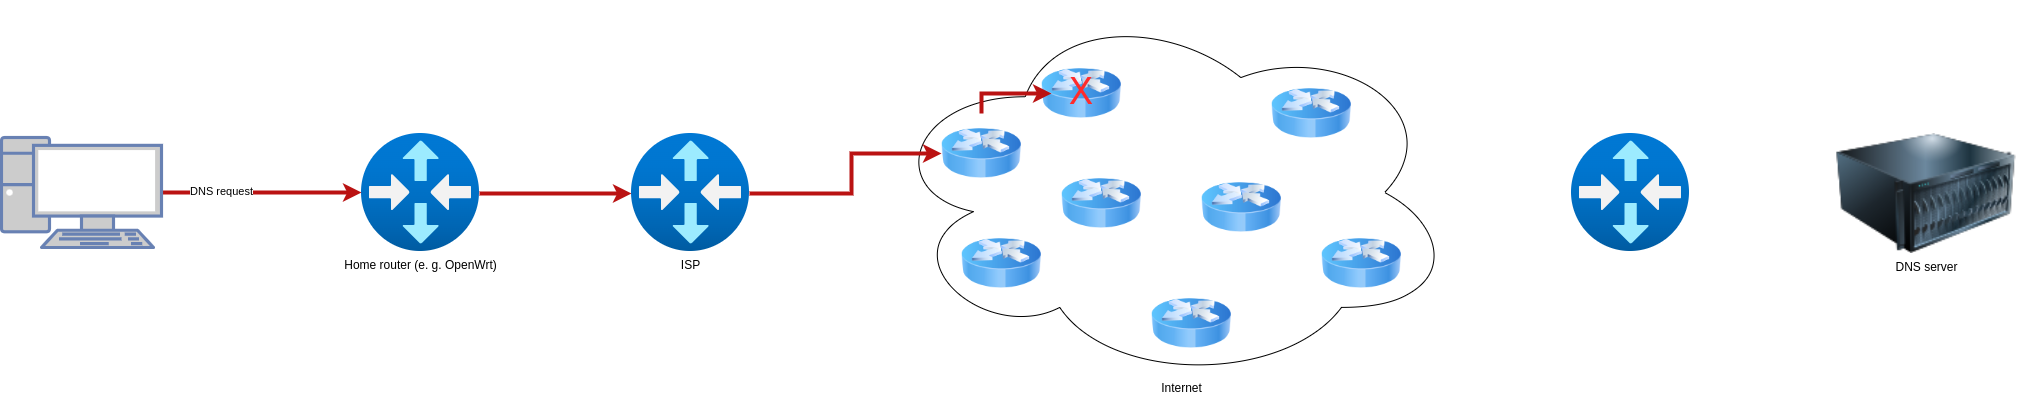
- The packet gets lost: DNS uses the connectionless UDP protocol by default. So it can happen that the packet gets lost without anyone noticing anything. In the case of DNS, the request is repeated a few times over UDP. However, if that also fails, the request is made over the TCP protocol.
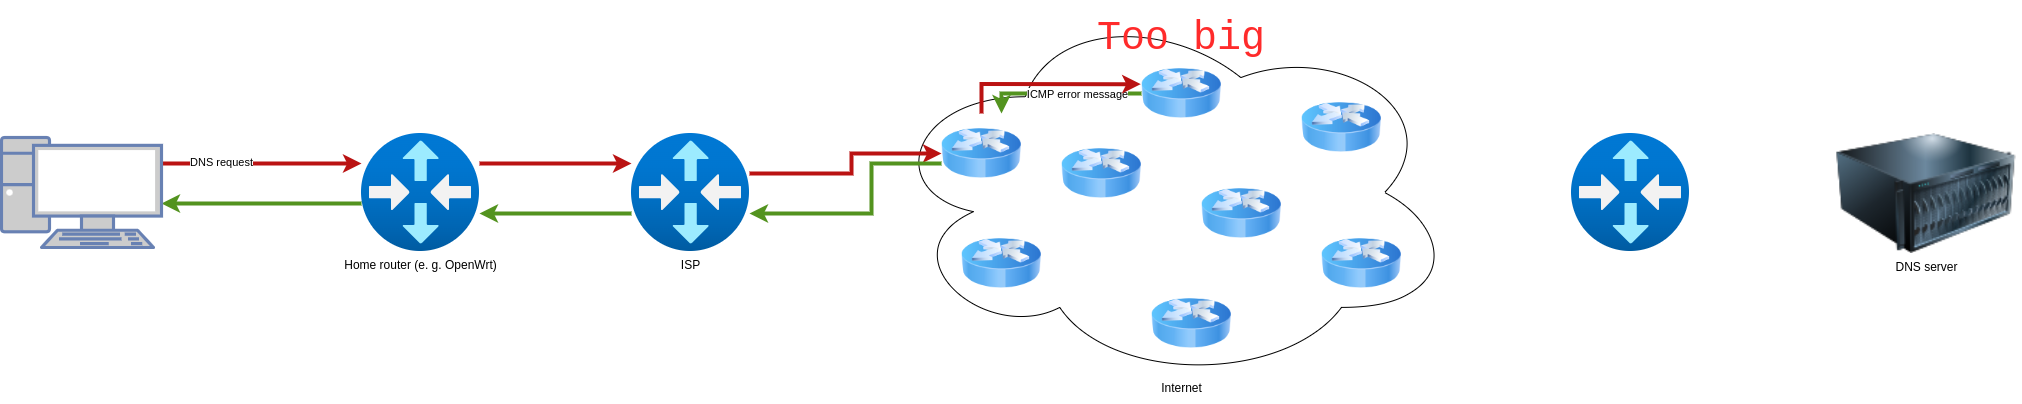
- The packet is too large: It is unlikely that this will happen in the case of DNS, but it can happen with other protocols. Each interface has a Maximum Transmission Unit (MTU). This describes the maximum size of the IP packet. If the packet is larger than the MTU, “something” happens. This “something” is different for IPv4 and IPv6. With IPv6 the packet is discarded and (if configured correctly) an ICMP error message is returned to the sender that the packet is too large. It must then usually be split into several smaller ones. The split packets are then reassembled at the receiver. With IPv4 the same happens if the “Don’t fragment” flag (a parameter in the IP header) is set. If it is not set, even the routers, which would otherwise return the ICMP error message, can split the packet and retransmit the split packets.
- If a request is sent with UDP or TCP, a port is set. However, if the port is not used by any program on the server, an ICMP error message is returned (if configured correctly) that no program is running on the port. However, it may also happen that the server’s firewall blocks the request and no ICMP error message is returned.

- The packet is on the way too long: Furthermore it can happen that the packet is on the way too long. Normally this is an indication that there is an error somewhere in the network. Every IP packet (so also UDP datagrams and TCP packets) get a Time to Live (TTL) value. After each hop (for example, each router) that the packet traverses, the TTL value is decreased by one. If the value reaches zero, an ICMP error message is returned. This value exists, among other things, to prevent loops from occurring and packets from circulating for ages. The maximum TTL value is 255, but often, but not always, a TTL value of 64 is used.
 5) The ICMP error message is blocked: There may be firewalls at both the server and routers that block the ICMP error message. This can be a nuisance for the sender as it does not know what happened to his packet.
Asymmetric routing
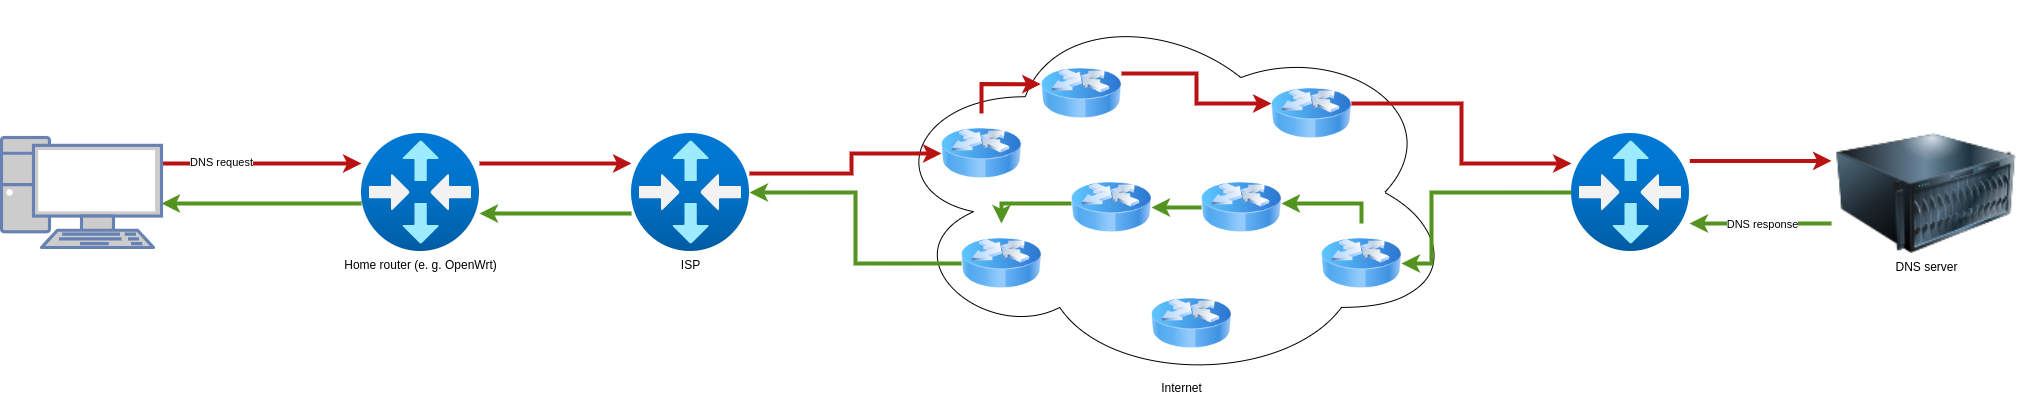
It may happen that packets do not take the same outward and return route. For example, a package may pass through eight hops on the outbound trip and only five hops on the return trip, or vice versa. There can also be the same number of hops on the outward journey as on the return journey, but these do not have to be the same as on the outward journey (same number of hops, different route). If something like this happens, it is called “asymmetric routing”, otherwise it is called “symmetric” routing. Asymmetric routing doesn’t have to be bad - but it can lead to problems with misconfigurations.
How does traceroute work?
Traceroute and tracepath in turn determine the hops (so computers that do IP routing) that lie between the sender and the recipient. The functionality of traceroute and tracepath is explained in the manual pages and is actually quite simple:
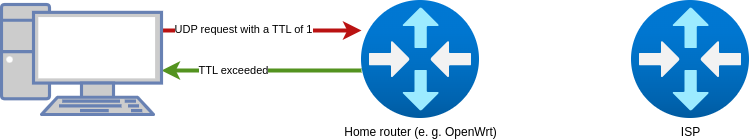
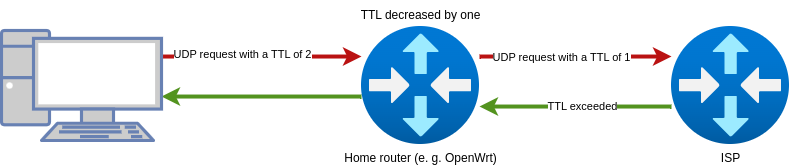
Traceroute sends out “probes” to the destination. These probes have a TTL of one, then two, and so on. When the TTL expires, an ICMP error message is returned. Since this error message also has a sender, you now know the router that sent the error message and thus you now know one of the routers that is on the path to the destination. In the next probe you increase the TTL by one and send the packet again. Another router should reply with an ICMP error message. This continues until you reach the destination. Traceroute tries to reach a probably unassigned UDP port. When the packet arrives at the server, it responds with an ICMP error message that no program is running on the port. This way you know that you have reached the destination.
traceroute tracks the route packets taken from an IP network on their way to a given host. It utilizes the IP protocol’s time to live (TTL) field and attempts to elicit an ICMP TIME_EXCEEDED response from each gateway along the path to the host.
This program attempts to trace the route an IP packet would follow to some internet host by launching probe packets with a small ttl (time to live) then listening for an ICMP “time exceeded” reply from a gateway. We start our probes with a ttl of one and increase by one until we get an ICMP “port unreachable” (or TCP reset), which means we got to the “host”, or hit a max (which defaults to 30 hops).
If the host is not reached after 30 hops, the attempt is aborted and only the previous hops are output.
By default, the ICMP error messages coming from the hops on the path do not contain any information about where they are on the path - i.e. whether they are the first, the second, the third, … Hop. Therefore Traceroute uses a little trick. The packets that Traceroute sends by default are UDP packets. With the TTL of one the port 33434 is used, with a TTL of two the port 33435, with a TTL of three the port 33436. Since the original packet comes back with the ICMP error message, traceroute can in turn determine the port from it, and so traceroute knows at which TTL (and therefore where on the path) the hop is located.
Traceroute can also be used with an ICMP and a TCP mode. So that instead of UDP packets ICMP or TCP packets are used.
Traceroute sends three packet probes to each hop. This can be adjusted with -q if needed.
How to interpret the output of traceroute?
$ traceroute -6 git.dn42
traceroute to git.dn42 (fd42:180:3de0:100:fc5f:3a14:838e:a7a7), 30 hops max, 80 byte packets
 1  de.hujk.dn42 (fd94:dba8:42b0:e::1)  4.102 ms  4.070 ms  4.052 ms
 2  de-fra1.burble.dn42 (fd42:4242:2601:31::1)  5.643 ms  5.621 ms  5.583 ms
 3  ca-bhs2.burble.dn42 (fd42:4242:2601:2d::1)  105.657 ms  105.936 ms  105.928 ms
 4  git.dn42 (fd42:180:3de0:100:fc5f:3a14:838e:a7a7)  105.900 ms  105.887 ms  105.852 ms
The first thing to do is to enter the traceroute command. You can use different parameters there. For example -6 for IPv6 or -4 for IPv4. Furthermore you can use -m or --max-hops= to set the maximum number of hops (30 by default).
With --mtu you can get the maximum MTU. This automatically implies that the packets must not be fragmented (manually adjustable with the -F flag) and that at most one probe may be sent at a time (adjustable with -N).
The reverse DNS (rDNS) name and the corresponding IP address are then displayed in the first line. Furthermore the maximum number of hops as well as the size of the packets is displayed. After that comes a listing. First the position of the hop. Then the rDNS name and the IP address. Furthermore the time, which the first, the second and the third probe took.
Determine MTU
$ traceroute -6 --mtu git.dn42
traceroute to git.dn42 (fd42:180:3de0:100:fc5f:3a14:838e:a7a7), 30 hops max, 65000 byte packets
 1  de.hujk.dn42 (fd94:dba8:42b0:e::1)  4.126 ms F=1420  4.162 ms  4.112 ms
 2  de-fra1.burble.dn42 (fd42:4242:2601:31::1)  5.114 ms F=1280  5.279 ms  5.382 ms
 3  ca-bhs2.burble.dn42 (fd42:4242:2601:2d::1)  103.731 ms  104.233 ms  104.718 ms
 4  git.dn42 (fd42:180:3de0:100:fc5f:3a14:838e:a7a7)  104.492 ms  104.539 ms  103.605 ms
Here, in addition to the previous output, an F= is added. After that the MTU is displayed. In this case you can see that the sender to the first host has an MTU of 1420. To the second host, however, there is an MTU of only 1280. So it is likely that the connection between en.hujk.dn42 and en-fra1.burble.dn42 has an MTU of only 1280.
A hop does not answer
$ traceroute vpnhub1.hack
traceroute to vpnhub1.hack (172.31.2.1), 30 hops max, 60 byte packets
 1  * * *
 2  * * *
 3  * * *
 4  * * *
 5  * * *
 6  * * *
 7  * * *
 8  * * *
 9  * * *
10  * * *
11  * * *
12  * * *
13  * * *
14  * * *
15  * * *
16  * * *
17  * * *
18  * * *
19  * * *
20  * * *
21  * * *
22  * * *
23  * * *
24  * * *
25  * * *
26  * * *
27  * * *
28  * * *
29  * * *
30  * * *
If a hop does not respond, this is shown with * * *. The * means that there was no response to this probe. This can be the case, for example, due to a too restrictive firewall. An rDNS name or IP address will then also not be shown, because the hop and its IP address are not known.
To work around this problem you can try the ICMP mode. In this mode ICMP messages are sent instead of UDP datagrams. Some firewalls only block UDP packets, but not ICMP packets.
$ traceroute -6 bbs.dn42
traceroute to bbs.dn42 (fd42:1919:810::3), 30 hops max, 80 byte packets
 1  de.hujk.dn42 (fd94:dba8:42b0:e::1)  4.143 ms  4.137 ms  4.108 ms
 2  * usw.hujk.dn42 (fd94:dba8:42b0:18::1)  157.087 ms  157.062 ms
 3  lax2.6.nico.dn42 (fd42:1919:810::3)  158.998 ms  158.981 ms  158.954 ms
Furthermore, it can also happen that only one hop has a firewall and the others do not. Furthermore, it is also possible that a hop only responds intermittently or partially to a probe.
Workaround
$ sudo traceroute -I vpnhub1.hack
traceroute to vpnhub1.hack (172.31.2.1), 30 hops max, 60 byte packets
 1  vpnhub1.hack (172.31.2.1)  3.526 ms  3.682 ms  3.674 ms
However, ICMP mode requires elevated privileges because raw ICMP messages are sent. Therefore, one can execute this with sudo. Another possibility is to give traceroute the cap_net_raw privilege:
sudo setcap cap_net_raw+ep $(realpath $(which traceroute))
There are also alternative ways to do this.
Error messages
traceroute can also display some, at first sight “cryptic”, hints.
$ traceroute -6 fd94:dba8:42b0:e::90
traceroute to fd94:dba8:42b0:e::90 (fd94:dba8:42b0:e::90), 30 hops max, 80 byte packets
 1  de.hujk.dn42 (fd94:dba8:42b0:e::1)  4.502 ms !N  4.450 ms !N  4.461 ms !N
In this case, an attempt is made to reach a host which cannot be reached. At the hop where this is detected, a !N is then displayed.
!N corresponds to the error message Destination unreachable: No route and means that the destination network or address is unreachable. For example, it could be temporarily disconnected from the main network or simply does not exist.
After the trip time, some additional annotation can be printed: !H, !N, or !P (host, network or protocol unreachable), !S (source route failed), !F (fragmentation needed), !X (communication administratively prohibited), !V (host precedence violation), !C (precedence cutoff in effect), or !
(ICMP unreachable code ). If almost all the probes result in some kind of unreachable, traceroute will give up and exit.
How does Tracepath work?
Tracepath works almost the same way as traceroute. In contrast to traceroute, however, it does not always use port 33434+, but a random one. Furthermore, tracepath always determines the MTU without additional parameters and therefore always sets the “Don’t fragment” flag in the IP header for IPv4. Another difference is that it sends only one probe instead of three.
How to interpret the output of tracepath?
$ tracepath -p 33434 herzstein.bandura.dn42
 1?: [LOCALHOST]                        0.008ms pmtu 1420
 1:  p2prouter.bandura.dn42                                0.504ms
 1:  p2prouter.bandura.dn42                                0.611ms
 2:  laplace.bandura.dn42                                 19.435ms
 3:  herzstein.bandura.dn42                              203.043ms reached
     Resume: pmtu 1420 hops 3 back 3
As always, the first thing to do is to call tracepath. With the option -p you can set the start port. In this case it was set to 33434 as in traceroute. This argument is optional. However, since my network, which I use in this example, only responds to UDP traceroutes, I had to set the port manually.
The first thing that is output is the position on the path, as with traceroute. If a ? is printed after the number, it means that the position is guessed. The first point in this case is the own computer, so localhost. This has an MTU of 1420 to the next hop. pmtu stands for path mtu. Furthermore, as with traceroute, the Round Tripe Time (RTT) is displayed - i.e. how long our packet took to get there and back. When the destination is reached, reached is displayed. Finally, we summarize again: A packet to the destination may be a maximum of 1420 bytes in size and takes three hops there and three back.
MTU and asymmetric routing
$ tracepath -p 33434 git.dn42
 1?: [LOCALHOST]                        0.008ms pmtu 1420
 1:  de.hujk.dn42                                          4.221ms
 1:  de.hujk.dn42                                          4.137ms
 2:  de.hujk.dn42                                          4.136ms pmtu 1280
 2:  tier1.de-fra1.burble.dn42                             5.133ms
 3:  tier1.ca-bhs2.burble.dn42                           105.222ms asymm  4
 4:  git.dn42                                            105.094ms reached
     Resume: pmtu 1280 hops 4 back 5
In this output, you can see that the MTU has changed on the way from 1420 to 1280. We could already see this with traceroute. With tracepath you can also clearly see that the MTU has changed between the 1 and 2 hops - i.e. between en.hujk.dn42 and en-fra1.burble.dn42. The second hop shows up twice in the output here because the sample had to be resent with the correct MTU, i.e. a smaller packet. So on the first pass, the packet was stopped at en.hujk.dn42, which thus appeared as the second hop. However, the adjusted packet was able to continue and was stopped at (due to the expired TTL) tier1.de-fra1.burble.dn42.
Furthermore, tracepath shows us that this is asymmetric routing. At the third hop there is the annotation asymm 4. This means that the packet probably needed four hops for the way back. However, this indication is not reliable (see below).
Finally, the summary is output again. The packet has traversed four hops to the destination and five hops back.
It should be noted that tracepath partially guesses the number of hops on the return path. This is calculated by reducing the presumably used maximum TTL by the TTL the return packet has when it arrives. However, since there is no standard for this, tracepath must guess the maximum TTL when it sends, so this specification is unreliable.
Output of IP addresses
If you prefer to output the IP addresses of the hops instead of the rDNS name, you can use the -n flag. If you want to output both the IP address and the rDNS name, you can use the -b option.
$ tracepath -p 33434 -n git.dn42
 1?: [LOCALHOST]                        0.008ms pmtu 1420
 1:  fd94:dba8:42b0:e::1                                   4.234ms
 1:  fd94:dba8:42b0:e::1                                   4.263ms
 2:  fd94:dba8:42b0:e::1                                   4.175ms pmtu 1280
 2:  fd42:4242:2601:31::1                                  5.338ms
 3:  fd42:4242:2601:2d::1                                104.775ms asymm  4
 4:  fd42:180:3de0:100:fc5f:3a14:838e:a7a7               104.840ms reached
     Resume: pmtu 1280 hops 4 back 5
Error Messages
$ tracepath -p 33434 fd94:dba8:42b0:e::120
 1?: [LOCALHOST]                        0.026ms pmtu 1420
 1:  de.hujk.dn42                                          4.484ms !N
 1:  de.hujk.dn42                                          4.156ms !N
     Resume: pmtu 1420
tracepath uses the same abbreviations for error messages as traceroute. If an error message is returned, the corresponding abbreviation is displayed after the RTT.
Manual traceroute using ping
What traceroute and tracepath do automatically can also be done using ping. The ping parameters -t to set the TTL, -s to determine the size of the payload (and thus the packet), -Mdo to prevent automatic fragmentation and, for IPv4, to set the “don’t fragment” flag, and -c to determine the number of pings help.
If we also want to determine the MTU, it is important to set the payload to the maximum value and disable automatic fragmentation with -Mdo.
The maximum payload is calculated by reducing the MTU of the outgoing interface (here 1420, visible with ip link) with the IP header (20 bytes for IPv4 and 40 bytes for IPv6) and the ICMP header (here: 4 bytes ICMP header + 4 bytes echo request header): 1420 bytes (MTU) - 40 bytes (IPv6) - 8 bytes (ICMP) = 1372 bytes Accordingly set the payload with -s.
This manual method would correspond to a traceroute in ICMP mode with MTU determination.
Request with maximum payload and a TTL of one:
$ ping -t1 -s 1372 -c1 -Mdo -6 git.dn42
PING git.dn42(git.dn42 (fd42:180:3de0:100:fc5f:3a14:838e:a7a7)) 1372 data bytes
From de.hujk.dn42 (fd94:dba8:42b0:e::1) icmp_seq=1 Time exceeded: Hop limit

--- git.dn42 ping statistics ---
1 packets transmitted, 0 received, +1 errors, 100% Paket loss, time 0ms
Request with maximum payload and a TTL of two:
$ ping -t2 -s 1372 -c1 -Mdo -6 git.dn42
PING git.dn42(git.dn42 (fd42:180:3de0:100:fc5f:3a14:838e:a7a7)) 1372 data bytes
From de.hujk.dn42 (fd94:dba8:42b0:e::1) icmp_seq=1 Paket too big: mtu=1280

--- git.dn42 ping statistics ---
1 packets transmitted, 0 received, +1 errors, 100% Paket loss, time 0ms
Here the MTU changes, so we recalculate the maximum payload with the new MTU: 1280 bytes (MTU) - 40 bytes (IPv6) - 8 bytes (ICMP) = 1232 bytes
Request with maximum payload and a TTL of two:
$ ping -t2 -s 1232 -c1 -Mdo -6 git.dn42
PING git.dn42(git.dn42 (fd42:180:3de0:100:fc5f:3a14:838e:a7a7)) 1232 data bytes
From tier1.de-fra1.burble.dn42 (fd42:4242:2601:31::1) icmp_seq=1 Time exceeded: Hop limit

--- git.dn42 ping statistics ---
1 packets transmitted, 0 received, +1 errors, 100% Paket loss, time 0ms
Request with maximum payload and a TTL of three:
$ ping -t3 -s 1232 -c1 -Mdo -6 git.dn42
PING git.dn42(git.dn42 (fd42:180:3de0:100:fc5f:3a14:838e:a7a7)) 1232 data bytes
From tier1.ca-bhs2.burble.dn42 (fd42:4242:2601:2d::1) icmp_seq=1 Time exceeded: Hop limit

--- git.dn42 ping statistics ---
1 packets transmitted, 0 received, +1 errors, 100% Paket loss, time 0ms
Request with maximum payload and a TTL of four:
$ ping -t4 -s 1232 -c1 -Mdo -6 git.dn42
PING git.dn42(git.dn42 (fd42:180:3de0:100:fc5f:3a14:838e:a7a7)) 1232 data bytes
1240 bytes from git.dn42 (fd42:180:3de0:100:fc5f:3a14:838e:a7a7): icmp_seq=1 ttl=60 time=105 ms

--- git.dn42 ping statistics ---
1 packets transmitted, 1 received, 0% Paket loss, time 0ms
rtt min/avg/max/mdev = 104.894/104.894/104.894/0.000 ms
Based on the successful response, we can see that we have reached the destination here. Thus, we have determined all hops as well as the maximum MTU and where it changes.
Notes
- TTL stands for time to live and is only used in IPv4. In IPv6, TTL is replaced by “Hop Limit” which serves the same function. For simplicity, I have only referred to TTL in this blog post.
- Packet loss can occur not only with UDP. It can also occur with ICMP or TCP. TCP, however, has mechanisms which ensure that a packet sent will arrive reliably. However, UDP is considered (minimally) faster, which is why it is used by default for DNS requests.
- ICMP is only used in IPv4. In IPv6 ICMPv6 is used. However, for simplicity, I will only talk about ICMP.
- Asymmetric routing cannot always be detected by Tracepath - for example, if the number of hops on the outbound and return paths are the same, but a different path was taken anyway.
- Doing traceroutes manually via ping is laborious and inefficient, but can give you a good understanding of how traceroute and tracepath work.
I have made an effort to be correct in content when writing this, but errors can still occur. If you find an error, I would be grateful if you email me :-)
Addendum
11.05.2023: Error message codes such as !X are not the same for traceroute and tracepath. For example, traceroute uses !X and tracepath uses !A if the message has been administratively filtered.
I could not find any documentation for the codes of Tracepath. Therefore, I opened an Issue on GitHub. But the meaning can be derived quite well from the source code:
| Ausgabe | Code | Bedeutung |
!A |
EACCES | Communication administratively prohibited |
!N |
ENETUNREACH | Destination network unreachable |
!H |
EHOSTUNREACH | Destination host unreachable |
!P |
EPROTO | Destination protocol unreachable |
This is what I could read from the source code. However, I am not sure if the table is correct.
Links
- 5 Ways to Traceroute - wikiHow
- What ports does trraceroute use?
- What does
!H1mean? - TracePath - eduPERT KB
- what does asymm mean in the results for a traceroute?
- Use icmplib without root privileges
- Why ping works without capability and setuid
- Please add cap_net_raw+ep capabilities to /bin/traceroute
- Security implications of using SETCAP CAP_NET_RAW